Friday 25 November 2011

Making box plots in Excel

A box plot conveys a lot of information and can be a very powerful tool. Excel does not generate these as part of its basic funtctions and I have never found time to learn how to do this in R or

Gather your data togather in columns, with labels on the top.


Calculate the fllowing:
Quartile 1: =QUARTILE(K4:K13,1) this returns the 25th percentile of the data in K4 to K13 of your table.
Min: =MIN(K4:K13), this returns the smallest of the numbers in K4 to K13.
Median: =MEDIAN(K4:K13), returns the median of the numbers in K4 to K13. The median is the number in the middle of a set of numbers; that is, half the numbers have values that are greater than the median, and half have values that are less.
Max: =MAX(K4:K13), this returns the largest of the numbers in K4 to K13.
Quartile 3: =QUARTILE(K4:K13,3) this returns the 75th percentile of the data in K4 to K13 of your table.


Creating the box plot chart:
 Highlight the calculation table and its headers (the data in the image above) and create a "Marked line" chart. You will then need to highlight the chart, right-click and "select data" then click the "Switch Row/Colum" button. Now you are ready to format the chart to create box plots as your data are in teh correct format with q1, min, median, max and q3 plotted for each column.


Right-click each data series in turn and format them to have no lines and no markers.

Format the "Up bars" so they have a black line.


There you have it a lovely box plot with not too much effort, that hopefully proves your point. I'm off to make mine with a reagent provider now!

Friday 18 November 2011

MiSeq: possible growth potential part 2

This post (and others like it) are pure speculation from me. I have no insider knowledge and am trying to make some educated guesses as to where technologies like this might go. This is part of my job description in many ways as I need to know where we might invest in new technologies in my lab and also when to drop old ones (like GA).

A while ago I posted about MiSeq potential and suggested we might get to 25Gb per flowcell. This was my first post on this new blog and I am sorry to say I forgot to divide the output on HiSeq by two (two flowcells) so my 25Gb should really have been closer to 12Gb. Consider it revised (until the end of this post).

In October 2007 the first GAI was installed in our lab. It was called the GAI because the aim was to deliver 1Gb of sequence data. It was a pain to run, fiddly, and the early quality was dire compared to where we are today. I remember thinking 2% error at 36bp was a good thing!

Now MiSeq is giving me twice the GAI yield "out-of-the-box".

Here is our instrument:
MiSeq at CRI

And here is the screenshot for run performance: this was taken at about 13:00 today after starting at 15:30 yesterday. If you look closely you can see we are already at cycle 206!
MiSeq installation run

MiSeq in MyLab: So now I can update you on our first run that has processed the in run yield prediction and other metrics. This is a PE151bp PhiX installation run.

MiSeq installation run metrics:
    Cluster density: 905K/mm2
    Clusters passing filter: 89.9%
    Estimated yield: 1913.5MB (I think this means about 6.4M reads)
    Q30: 90.9%  

What is the potential:
So our first run is double the quoted values from Illumina on release.

Broad have also performed a 300bp single end run and if some extra reagents could be squeezed into the cartridge (reconfigured tubes that are a bit fatter perhaps) then PE300 is possible if you wanted to run for 2 days. This would yield 4Gb based on my current run.

We only need an increase of 3x in yield to hit my revised 12Gb estimate, read on...

At the recent Illumina UK UGM we had a discussion in one of the open floor sessions on what we wanted from an instrument like MiSeq. The Illumina team discussed options such as reducing read quality to allow faster runs. This would be achieved by making chemistry cycles even shorter. Currently chemistry takes 4 minutes and imaging takes 1, for a combined 5 minute cycle time.
Reducing chemistry cycle times would speed up the combined cycle time and allow longer runs to be performed, this would impact quality (by how much is not known and Illumina would not say). If you do teh same with imaging then you increase yield but make run times longer.

If you play with chemistry and imaging cycle times you can generate a graph like this one.
In this I have kept cycle time constant but varied chemistry and imaging times. The results are pretty dramatic. The peak in the middle of the table represents a 1min Chemistry / 1 min Imaging run, giving the same number of clusters as today (nearly 7M in my case) on a staggering 720bp run. This may be achievable using the standard reagent cartridge if less chemistry is actually used in the cycling (I just don't know about this). If you are happy to increase run times to two days then a low quality (maybe Q20) 1400bp (PE700) run would be pretty cool.

Even if this is a step too far then dialling in quality and playing with imaging could allow some really cool methods to be developed. What about a strobe sequencing application that gave high quality data at the start, middle and end of a 1000bp cluster for haplotyping but did not collect images in the middle? The prospects are interesting.

As I said at the start this is speculation by me and the reality may never get quite as far as 1400bp on SBS chemistry. We can keep our fingers corssed and I hope that exactly this kind of sepculation drives people to invent the technologies that will delvier this. After all if Solexa had not tried to build a better sequencer we would not be where we are today.

I thought I might trade in my remaining GA's for a HiSeq but perhaps I'd be better off asking for two more MiSeq's instead?

Who knows; HiSeq2000 at 600GB (2 flowcells),  HiSeq1000 at 300GB (1flowcell), MiSeq at 35GB (equivalent to 1 lane)?

Competitive by nature: Helen (our FAS) would not let me try to max out loading of the flowcell, I do feel a little competitive in getting the highest run yield so far. Did you know Ion offer a $5000 prize for a record braking run each month? Their community is actually quite a good forum, and I hope they don't kick me off!

Mis-quantification of Illumina sequencing libraries is costing us 10000 Human genomes a year (or how to quantitate Illumina sequencing libraries)

I was at the 3rd NGS congress in London on Monday and Tuesday this week and one of the topics we discussed in questions was quantitation of Illumina sequencing libraries. It is still a challenge for many labs and results in varying yields. The people speaking thought that between 5-25% of possible yield was being missed through poor quantification.

Illumina recommend a final concentration of 10–13 pM to get optimum cluster density from v3 cluster kits. There is a hug sample prep spike in NGS technologies where a samples is adapter ligated and massively amplified so a robust quantification can allow the correct amount of library to be added to the flowcell or picotitre-plate. If a sensitive enough system is sued then no-PCR libraries can be used. Most people are stil using PCR amplification and lots of the biases have been removed with protocol improvements.

The method of DNA quantitation is important (no-one wants to run titration flow cells). There are many methods that can be used and I thought I 'd give a run down of the pro's and cons' for each of these (see below). The LOQ values are taken from Digital PCR provides sensitive and absolute calibration for high throughput sequencing, and I have ordered systems by sensitivity (lowest to highest).

Which one to use: Most labs choose the method that suits them best and this is dependant on skills and experience and also what equipment is available for them to use. However even in the best labs getting cluster density spot on has not been perfected and methods could still be improved (I'm currently working on a solution).

In my lab we find that careful use of the Bioanalyser gives us quantitative and qualitative information from just 1 ul of sample. I think we may move to qPCR now we are making all libraries using TruSeq.

Why is this important? If you agree that 5-20% of achievable yield is being missed then we can work out how many Human genomes we could be sequencing with that unused capacity. To work this out I made some assumptions about the kind of runs people are performing and use PE100 as the standard. On GAIIx I used 50Gb as the yield and 12 days as the run time, for HiSeq I used 250Gb and 10 days. There are currently 529 GAIIx and 425 HiSeq instruments worldwide according to the map. I assumed that these could be used 80% of the time (allowing for maintenance and instrument failures), even though many are used nowhere near that capacity.

Total achievable yield for the world in PE100 sequencing is a staggering 7.5Pb.

Missing just 5% of that through poor quantification loses us 747Tb or about 3500 Human genomes at 100x coverage.

Missing 20% loses us 1500Tb or about 15000 Human genomes at 100x coverage.

We need to do better!

The quantitation technology review:
Agilent Bioanalyser (and others) (LOQ 25ng): The bioanalyser uses a capillary electrophoresis chip to run a virtual gel. Whilst the sensitivity is not as good as qPCR or other methods a significant advantage is the collection of both quantitative and qualitative data from a single run using 1ul of library. The Bioanalyser has been used for over a decade to check RNA quality before microarray experiments. The qualitative analysis allows poor libraries to be discarded before any sequence data are generated and this has saved thousands of lanes of sequencing from being performed unnecessarily.

Bioanalyser quantitation is affected by over or under loading and the kits commonly used (DNA1000 and High-Sensitivity) have upper and lower ranges for quantitation. If samples are above the marker peaks then quantitation may not be correct. Done well this system provides usable and robust quantification.

Many labs will run Bioanalyser even if they prefer a different quantitative assay for determining loading concentrations. New systems are also available from Caliper, Qiagen, Shimazdu and I recently saw a very interesting instrument from Advanced Analytical which we are looking at.
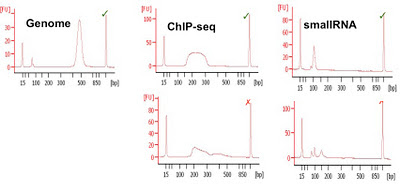
Examples of Bioanalyser libraries (good and bad) from CRI


UV spectrophotometry (LOQ 2ng): Probably the worst kind of tool to use for sequencing library quantification. Spectrophotometry is affected by contaminants and will report a quantity based on absorbance by anything in the tube. For the purpose of library quantification we are only interested in adapter ligated PCR products, yet primers and other contaminants will skew the results. As a result quantification is almost always inaccurate.

This is the only platform I would recommend you do not use.

Fluorescent detection (LOQ 1ng): Qubit and other plate based fluorometer use dyes that bind specifically to DNA , ssDNA or RNA and a known standard (take care when making this up) to determine a quantitative estimate of the test samples actual concentration. The Qubit uses Molecular Probes fluorescent dyes which emit signals ONLY when bound to specific target molecules, even at low concentrations. There are some useful resources on the Invitrogen website and a comparison of Qubit to nanodrop. I don't think it's nice to bash another technology but the Qubit is simply better for this task.
Qubit from Invitrogen website

You can use any plate reading fluorometer and may already have one lurking in your lab or institute.

qPCR (LOQ 0.3-0.003fg): Quantitative PCR (qPCR) is a method of quantifying DNA based on PCR. During a qPCR run intensity data are collected after each PCR cycle from either probes (think TaqMan) or intercalating chemistry (think SYBR). The intensity is directly related to the number of molecules present in the reaction at that cycle and this is a function of the starting amount of DNA. Typically a standard curve (take care when making this up) is run and unknown test samples are compared to the curve to determine a quantitative estimate of the samples actual concentration. qPCR is incredibly sensitive and quite specific and is the method most people recommend.

You can use any qPCR machine and either design your own assay or use a commercial one. You don't need to buy an Illumina qPCR machine or thier kit, just use the onw available in your lab or one next door and spend the money saved on another genome or three!

In the Illumina qPCR quantification protocol they use a polymerase, dNTPs, and two primers designed to the adapter sequences. The primer and adapter sequences are available from Illumina TechSupport but you do have to ask for the and they should not be generally shared (I don't know why they don't just put them on the web, everyone who wants to know does). The design of the assay means that only adapter ligated PCR products should amplify and you will get a very good estimate of concentration fro cluster density. Adapter dimers and other concatamers may also amplify so you need to make sure your sample is not contaminated with too much of these. Illumina also demonstrated that you can use a dissociation curve to determine GC content of your library. You can use this protocol as a starting point for your own if you like.

Illumina qPCR workflow
GC estimation by dissociation curve


Digital PCR (LOQ 0.03fg): Fluidigm's digital PCR platform has been released for library quanitifaction as the SlingShot kit, available for both Illumina and 454. This kit does not require a calibrator samples and uses positive well counts to determine a quantitative estimate of the samples actual concentration. A sinlge qPCR reaction is setup and loaded onto the Fluidigm chip. This reaction gets partitioned into 765 9nl chambers for PCR. The DNA is loaded at a concentration that results in many wells having no template present. The count of positive wells after PCR is directly related to starting input and quantitation s very sensitive.
SlingShot image from Fluidigm brochure

The biggest drawback is the need to buy a very expensive piece of hardware and this technology has only been adopted by labs using Fluidigm for other applications or in some large facilities.
Those are pretty big numbers and many more genomes than are being sequenced in all but the largest of consortia led projects.

Thursday 17 November 2011

Cufflinks (the ones you wear not the RNA-seq tool)

Thanks very much to the people that sent me some more chips for an improved set of cuff links. I was not sure whether you required anonymity or not so erred on the side of caution!

It would take quite a nerd to spot the difference between the chips but I shall probably stick to wearing the 318's until the 5 series comes out next year.

314's (left), 316's (right), 318's are in the box)


I now have quite a nice collection of NGS and array consumables for my mini-museum, but if you have something you think would be good to incorporate then do let me know by adding a comment.

And here's my Christmas flowcell from 2007.


(Anyone got an old ABI array?)

Wednesday 9 November 2011

Something for Mr Rothbergs Christmas stocking?

I have been collecting genomics technologies for a while to create a little display of old and current consumables. As part of this collecting I had more Ion chips than I needed and decided to try and get creative.

The result is (I think) quite a nice pair of cufflinks that I shall wear when I put on a proper shirt for presentations. Expect to see these at the 3rd NGS congress and at AGBT (if I get in, only The Stone Roses sold out faster this year). 


If anyone wants a pair let me know and I am sure we can come to some arrangement including a donation to CRUK. If you have any Ion chips lying around the lab please do send them to me.

Making these made me think of what other things could be done with microarray and sequencing consumables. We spend a fortune on what are disposable items and surely we can come up with interesting ways to reuse these. I will try to get some old Affy chips to do the same with, but they could be a little large. Four years ago we had some flowcells hanging on the Institute Christmas tree.
What else can you come up with?

I am still collecting for my ‘museum’. If anyone has the following please get in touch if you are willing to donate.

My wish list:
373 or 377 gel plates
Affymetrix U95A&B set
ABI gene expression array
Helicos flowcell
Ion torrent 316 and 318 chips
Seqeunom chip

Wednesday 2 November 2011

Illumina generates 300bp reads on MiSeq at Broad

Danielle Perrin, from the genome centre at Broad presents an interesting webinar demonstrating what the Broad intends to do with MiSeq and lastly a 300bp single read dataset. Watch the seminar here. I thought I'd summarise the webinar as it neatly follows on from a previous post, MiSeq growth potential. Where I speculated that MiSeq might be adapted for dual surface, larger tiles to get up to 25Gb. There is still along way to go to get near this but if the SE300 data presented by Broad holds up for PE runs then we jump to 3.2Gb per run.
Apparently this follows up from an ASHG presentation but as I was not there I missed it.


Apparently Broad has six MiSeq's. Now I understand why mine has yet to turn up! I must add these t the Google map of NGS.

MiSeq intro: The webinar starts with an intro to MiSeq if you have not seen one and goes through cycle time, chemistry and interface. They have run 50 flowcells on 2 instruments since August. They are now up to 6 boxes running well. No chemistry or hardware problems yet and software is being developed.

What will broad do with it? At the Broad they intend to run many applications on MiSeq: Bacterial assembly, library QC, TruSeq Custom Amplicon, Nextera Sample Prep and Metagenomics. So far they have run 1x8 to 2x151 runs and one 1x300 run.
2x150 metrics look good at  89% Q30, 1.7Gb, 5.5M reads 0.24% error rate.
Getting cluster density right is still hard even at Broad (something for another blog?). They use Illumina's Eco qPCR system for this.

Bacterial Assembly: The Broad has a standard method for bacterial genomics which uses a mix of libraries; 100x coverage of 3-5KB libs, 100x coverage of 180bp libs, 5ug DNA input and AllPaths assembly. They saw very good concordance from MiSeq to HiSeq. And the MiSeq assembly was actually higher but Danielle did not say why (read quality perhaps).

library QC: 8bp index in all samples by ligation (they are not using TruSeq library prep at Broad) 96well library prep, pool all libraries and run it son the number of lanes required based on estimated coverage. QC of these libraries and evenness of pools is important. They run the index first and if the pool is too uneven they will kill the flow cell and start again. They use a positive control in every plate and run as a 2x25bp run to check the quality of the plate. Thinking of moving this QC to MiSeq to improve QC turnaround. They aim to run the same denatured pool onto HiSeq after MiSeq QCC. This will avoid a time delay requiring the denaturation to be repeated. Very important in ultra low input libraries where you can run out if flow cells need to be repeated. All QC metrics seem to correlate well between MiSeq and HiSeq.

Amplicons: They presented Nextera validation of 600bp amplicons: 8 amplicons, pool, Nextera, MiSeq workflow (very similar to the workflow I discussed in a recent Illumina interview). And TruSeq Custom Amplicon (see here), Illumina's GoldenGate extension:ligation and PCR system. After PCR samples are normalised using a bead based method, pooled, run on MiSeq (without quantification) and analysed. Danielle showed a slide (#34) with the variation seen in read numbers per sample after bead based normalisation and a CV of only 15%.  I wonder if the bead normalisation method will be adopted for other library types?

SE300bp run: The Broad took a standard kit and ran it as a 300bp single end run. They have done this once and first time round achieved 1.6Gb, 5.29M read, 65%Q30, 0.4% error. Pretty good to start with and hopefully demonstrating the future possibilities.

How long can you go, 550bp amplicons (PE300) anyone? Another goodbye 454 perhaps?